
Use patchwork and R Markdown for multi-image slide layouts in PowerPoint
Recently at work, I’ve been building R Markdown documents to generate PowerPoint slides. In general, this is a pretty straightforward process and is described in R Markdown: The Definitive Guide. One limitation they note is:
Images and tables will always be placed on new slides. The only elements that can coexist with an image or table on a slide are the slide header and image/table caption. When you have a text paragraph and an image on the same slide, the image will be moved to a new slide automatically.
That is a bummer for me because the original PowerPoint slides I am trying to replicate using R Markdown have multiple images and tables on them. An alternative to using PowerPoint would be xaringan and doing some fancy layout using CSS, but I’m not very good at CSS and we need the slides in PowerPoint format because other folks at the office add additional slides to the presentations I generate.
Around this time, I was reading tweets about new development on the patchwork package for arranging ggplot objects, and thought that instead of including multiple images on one slide, I could just create a multi-image layout in R and then render that layout to the PowerPoint slide.
In this post, I show how to combine plots and tables using patchwork to create multi-image PowerPoint slides using R Markdown.
I’m going to use data from the gapminder package, so if you don’t have it installed:
install.packages("gapminder")On my slide, I want to include 2 plots and 1 table related to life expectancy of certain counties in East Africa. I’m going to start by making the plots and then I’ll combine them in a single layout, and finally render the image to PowerPoint.
First, I load the needed packages and filter the gapminder data to the five countries in East Africa I’m going to be examining.
library(tidyverse)
library(gapminder)
library(scales)
library(gridExtra)
library(patchwork)

my_countries <- c("Zambia", "Malawi", "Mozambique", "Tanzania", "Kenya")

east_africa <- gapminder %>%
  filter(country %in% my_countries) %>%
  mutate(country = fct_reorder2(country, year, lifeExp)) # reorder for plotting
If you haven’t worked with the gapminder data before, take a peak. There is one row per country per year, with life expectancy, population, and GDP for each observation.
head(east_africa)
## # A tibble: 6 x 6
##   country continent  year lifeExp      pop gdpPercap
##   <fct>   <fct>     <int>   <dbl>    <int>     <dbl>
## 1 Kenya   Africa     1952    42.3  6464046      854.
## 2 Kenya   Africa     1957    44.7  7454779      944.
## 3 Kenya   Africa     1962    47.9  8678557      897.
## 4 Kenya   Africa     1967    50.7 10191512     1057.
## 5 Kenya   Africa     1972    53.6 12044785     1222.
## 6 Kenya   Africa     1977    56.2 14500404     1268.
The first plot I’m going to make is a bar chart of life expectancy by country for the most recent year of data, 2007.
bar <- east_africa %>%
  filter(year == max(year)) %>%  # most recent year only
  ggplot(aes(x = country, y = lifeExp, fill = country)) +
  geom_col(width = 0.75, alpha = 0.9) +
  geom_text(
    aes(label = number(lifeExp, 0.1)),
    position = position_stack(vjust = 0.5),
    color = "white",
    fontface = "bold",
    size = 5
    ) +
  scale_fill_brewer(palette = "Dark2") +
  scale_y_continuous(expand = expand_scale(0.01, 0.05)) +  # remove extra space between bars and x-axis labels
  labs(y = "Life Expectancy (years)") +
  theme_minimal(base_size = 16) +
  theme(
    legend.position = "none",
    axis.title.x = element_blank(),
    axis.title.y = element_text(size = 10),
    axis.title.y.left = element_text(margin = margin(r = 10)),
    panel.grid.minor = element_blank(),
    panel.grid.major.x = element_blank()
    )

bar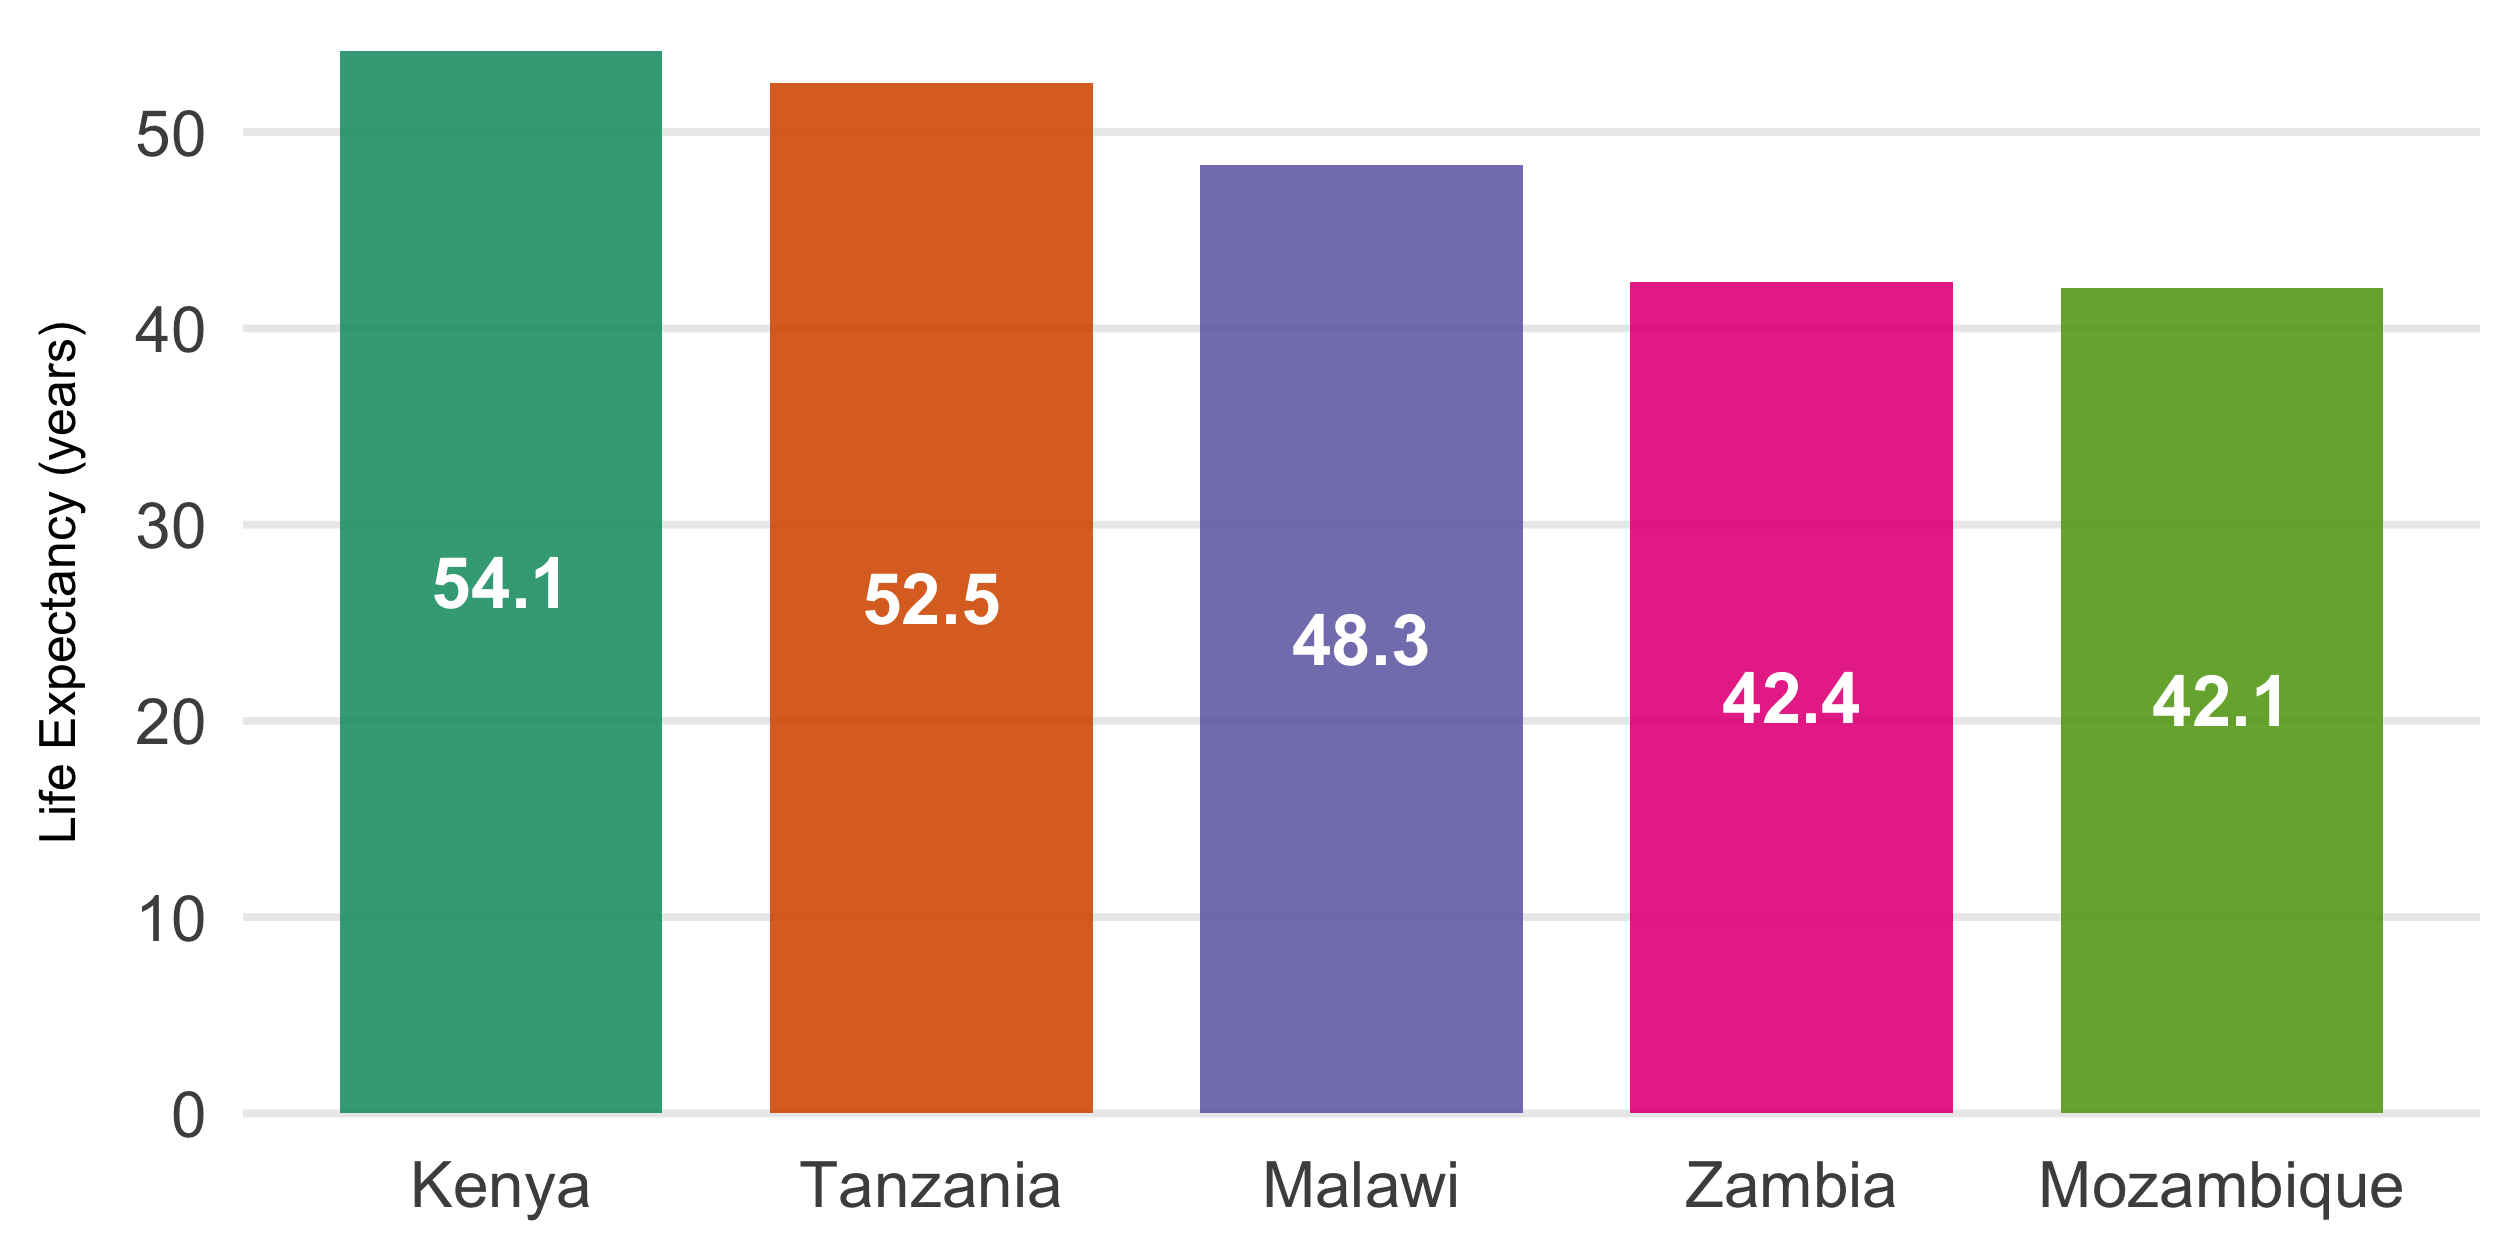
Next, a line chart to look at the trend in life expectancy by country over time.
line <- east_africa %>%
  ggplot(aes(x = year, y = lifeExp, color = country)) +
  geom_line(lwd = 1.25, key_glyph = "timeseries") +  # for those cute glyphs in the legend
  scale_color_brewer(palette = "Dark2") +
  labs(y = "Life Expectancy (years)") +
  theme_minimal(base_size = 16) +
  theme(
    legend.position = "bottom",
    legend.title = element_blank(),
    axis.title.x = element_blank(),
    axis.title.y = element_text(size = 10),
    axis.title.y.left = element_text(margin = margin(r = 10)),
    panel.grid.minor = element_blank(),
    plot.margin = margin(t = 30)
  )

line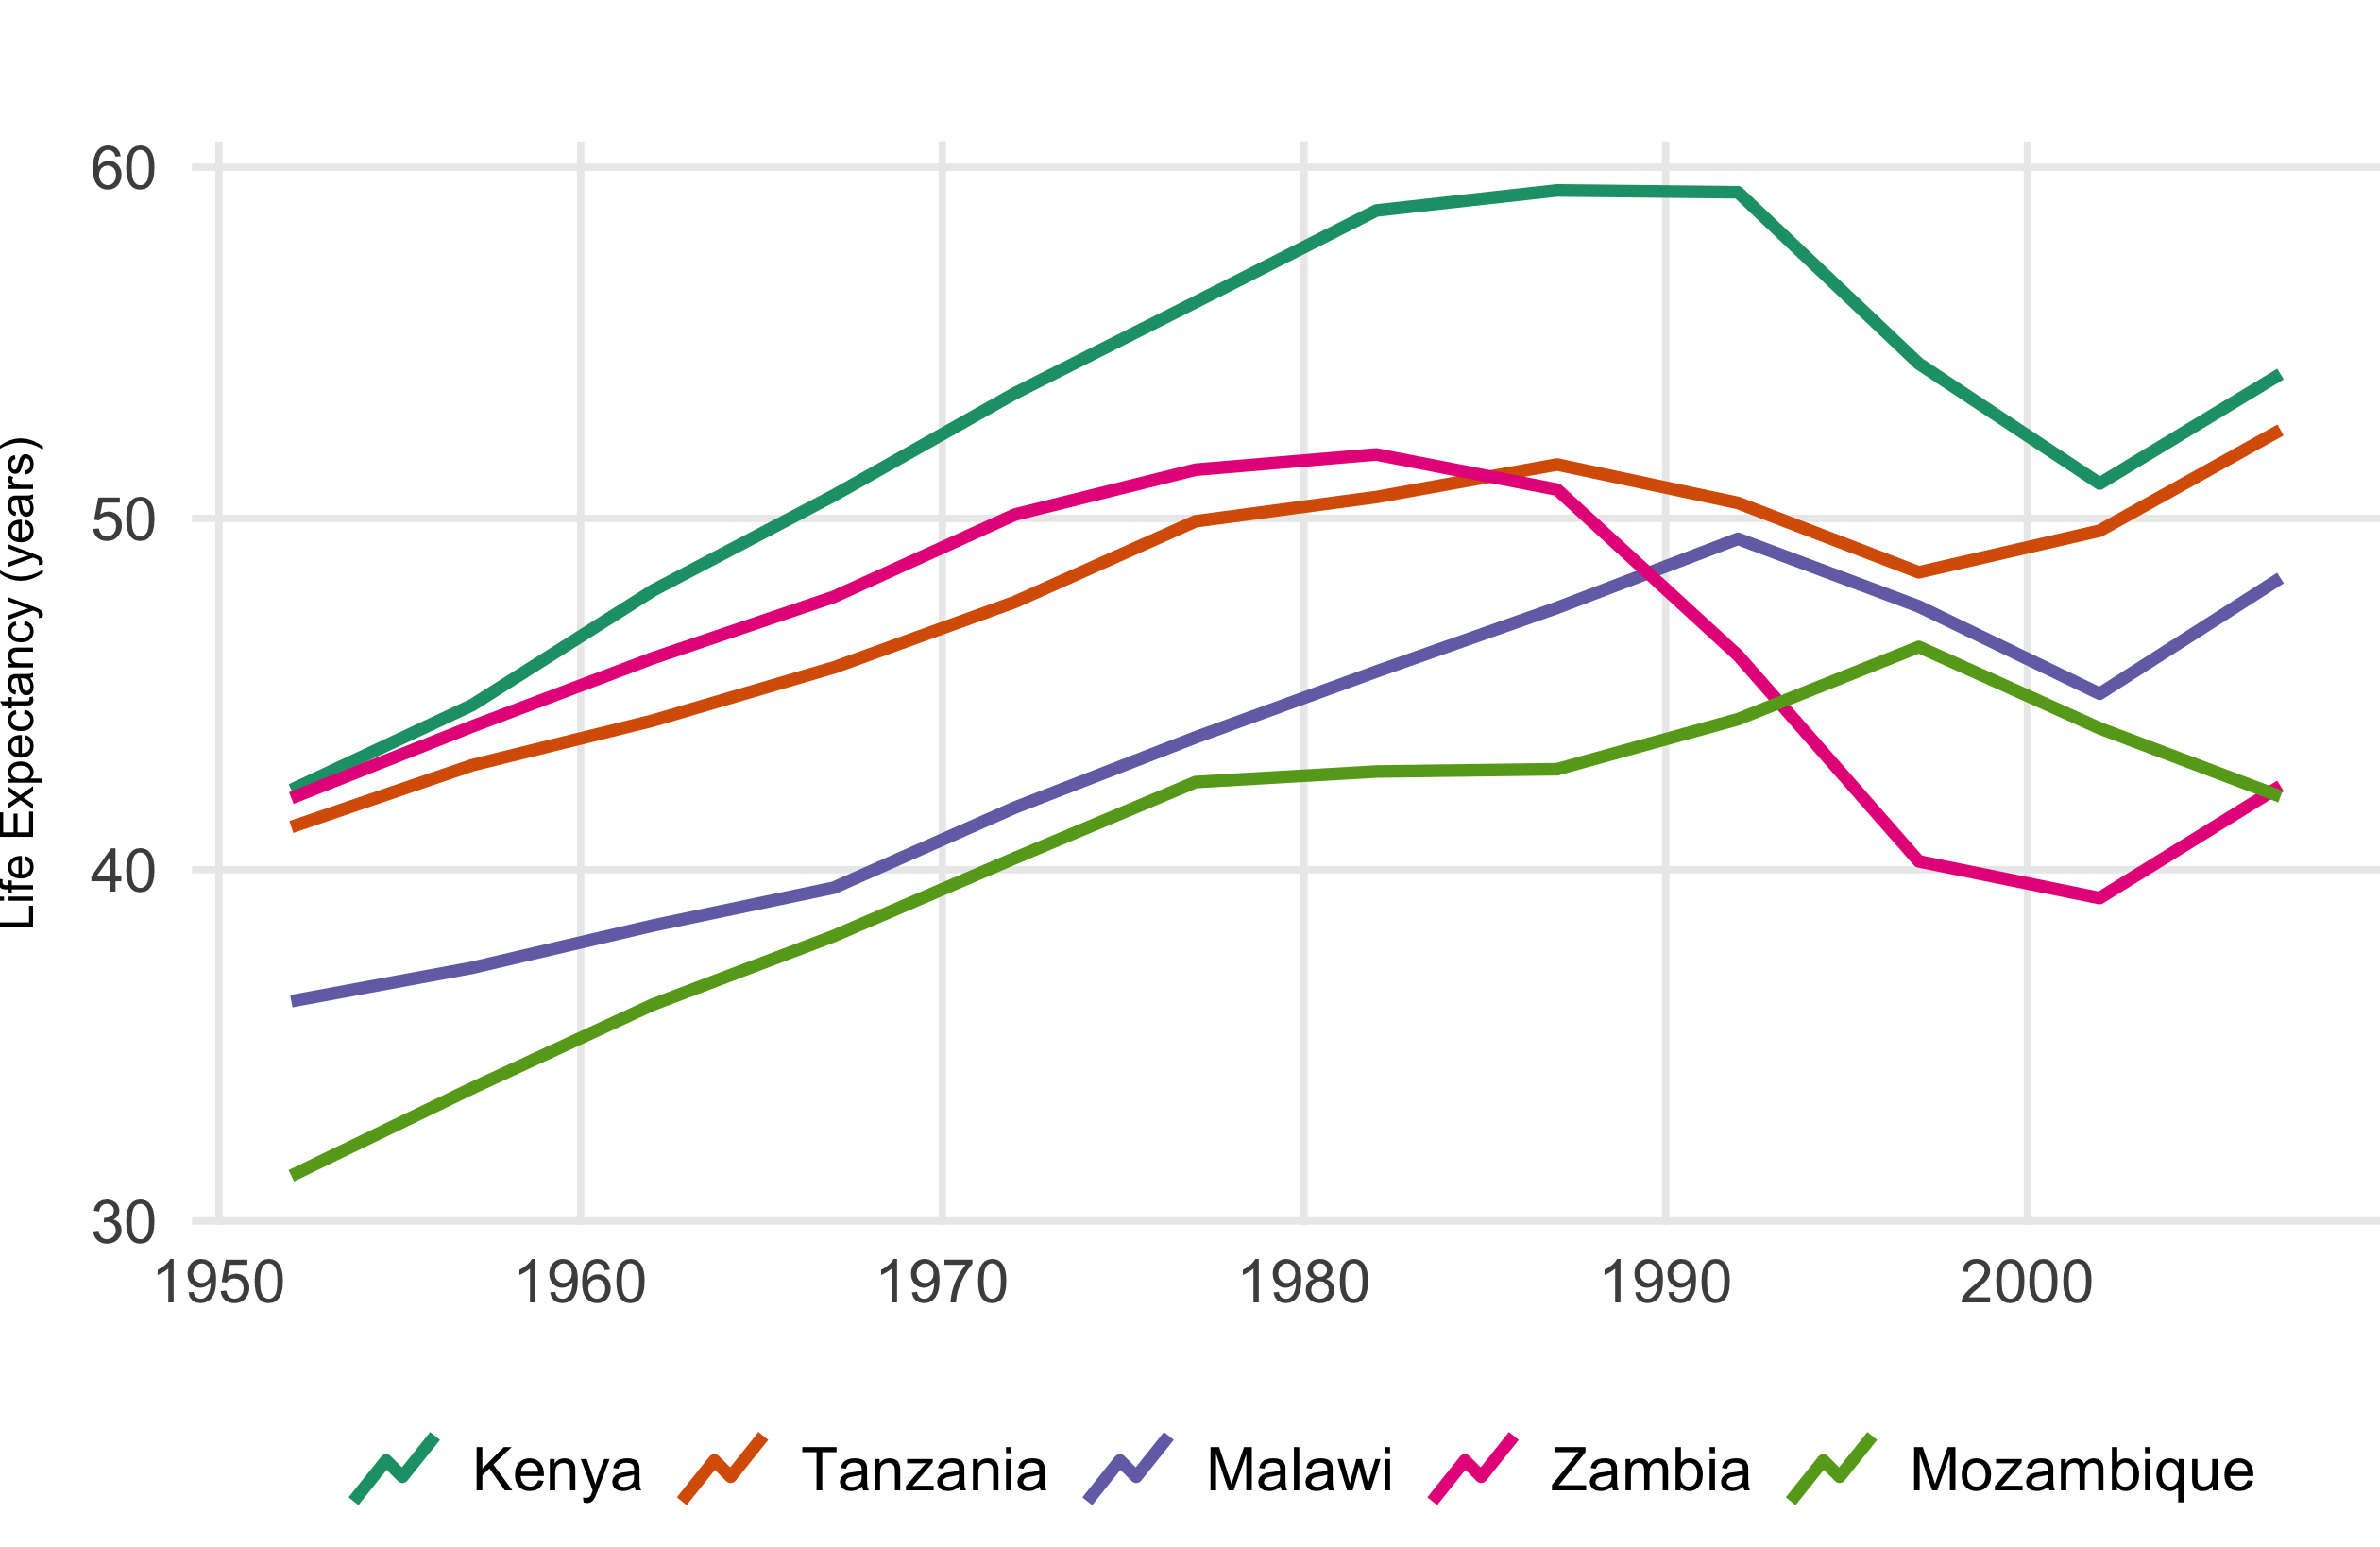
Lastly, a table with life expectancy, population, and GDP for each country for the most recent year of data. To make a table that I can combine with the above ggplots, I’ll use gridExtra::tableGrob(), which renders tables as grobs (grid graphical objects).
tab <- east_africa %>%
  filter(year == max(year)) %>%
  transmute(
    Country = country,
    Population = comma(pop),
    `GDP per capita` = dollar(gdpPercap, 1),
    `Life Expectancy` = number(lifeExp, 0.1),
    ) %>%
  arrange(Country) %>%
  tableGrob(theme = ttheme_minimal(), rows = NULL)

grid.arrange(tab)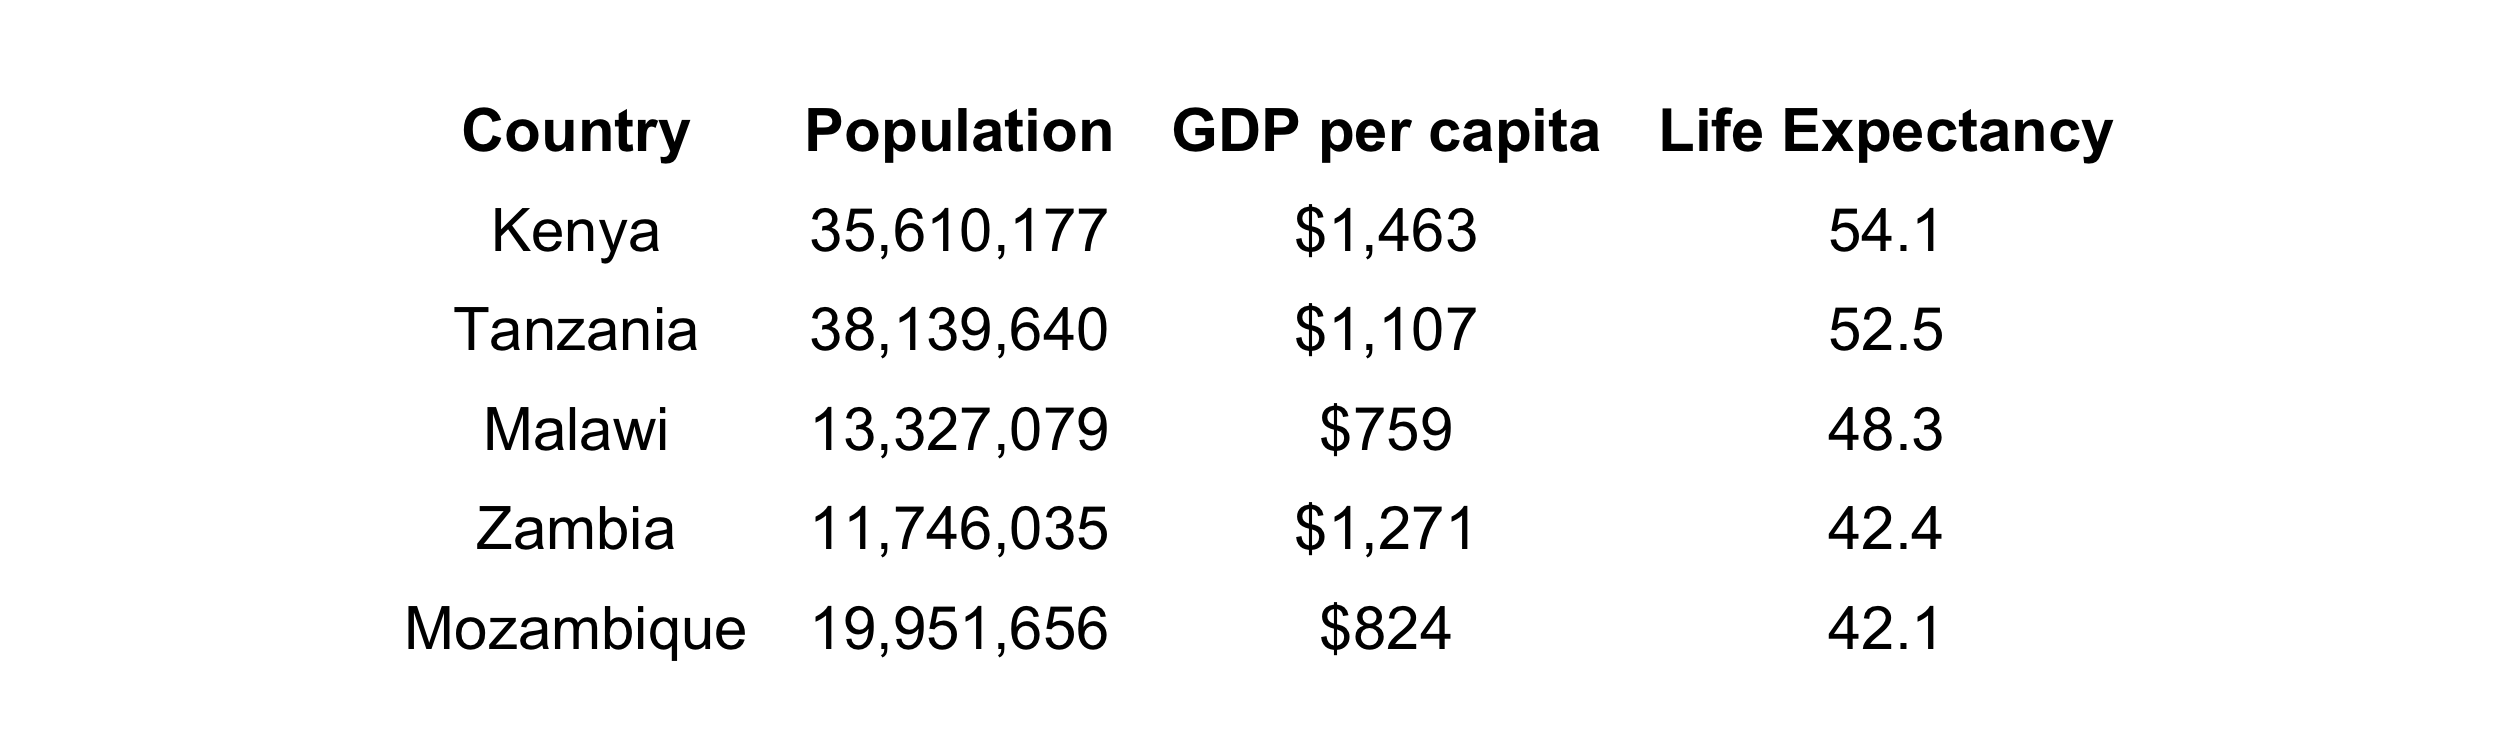
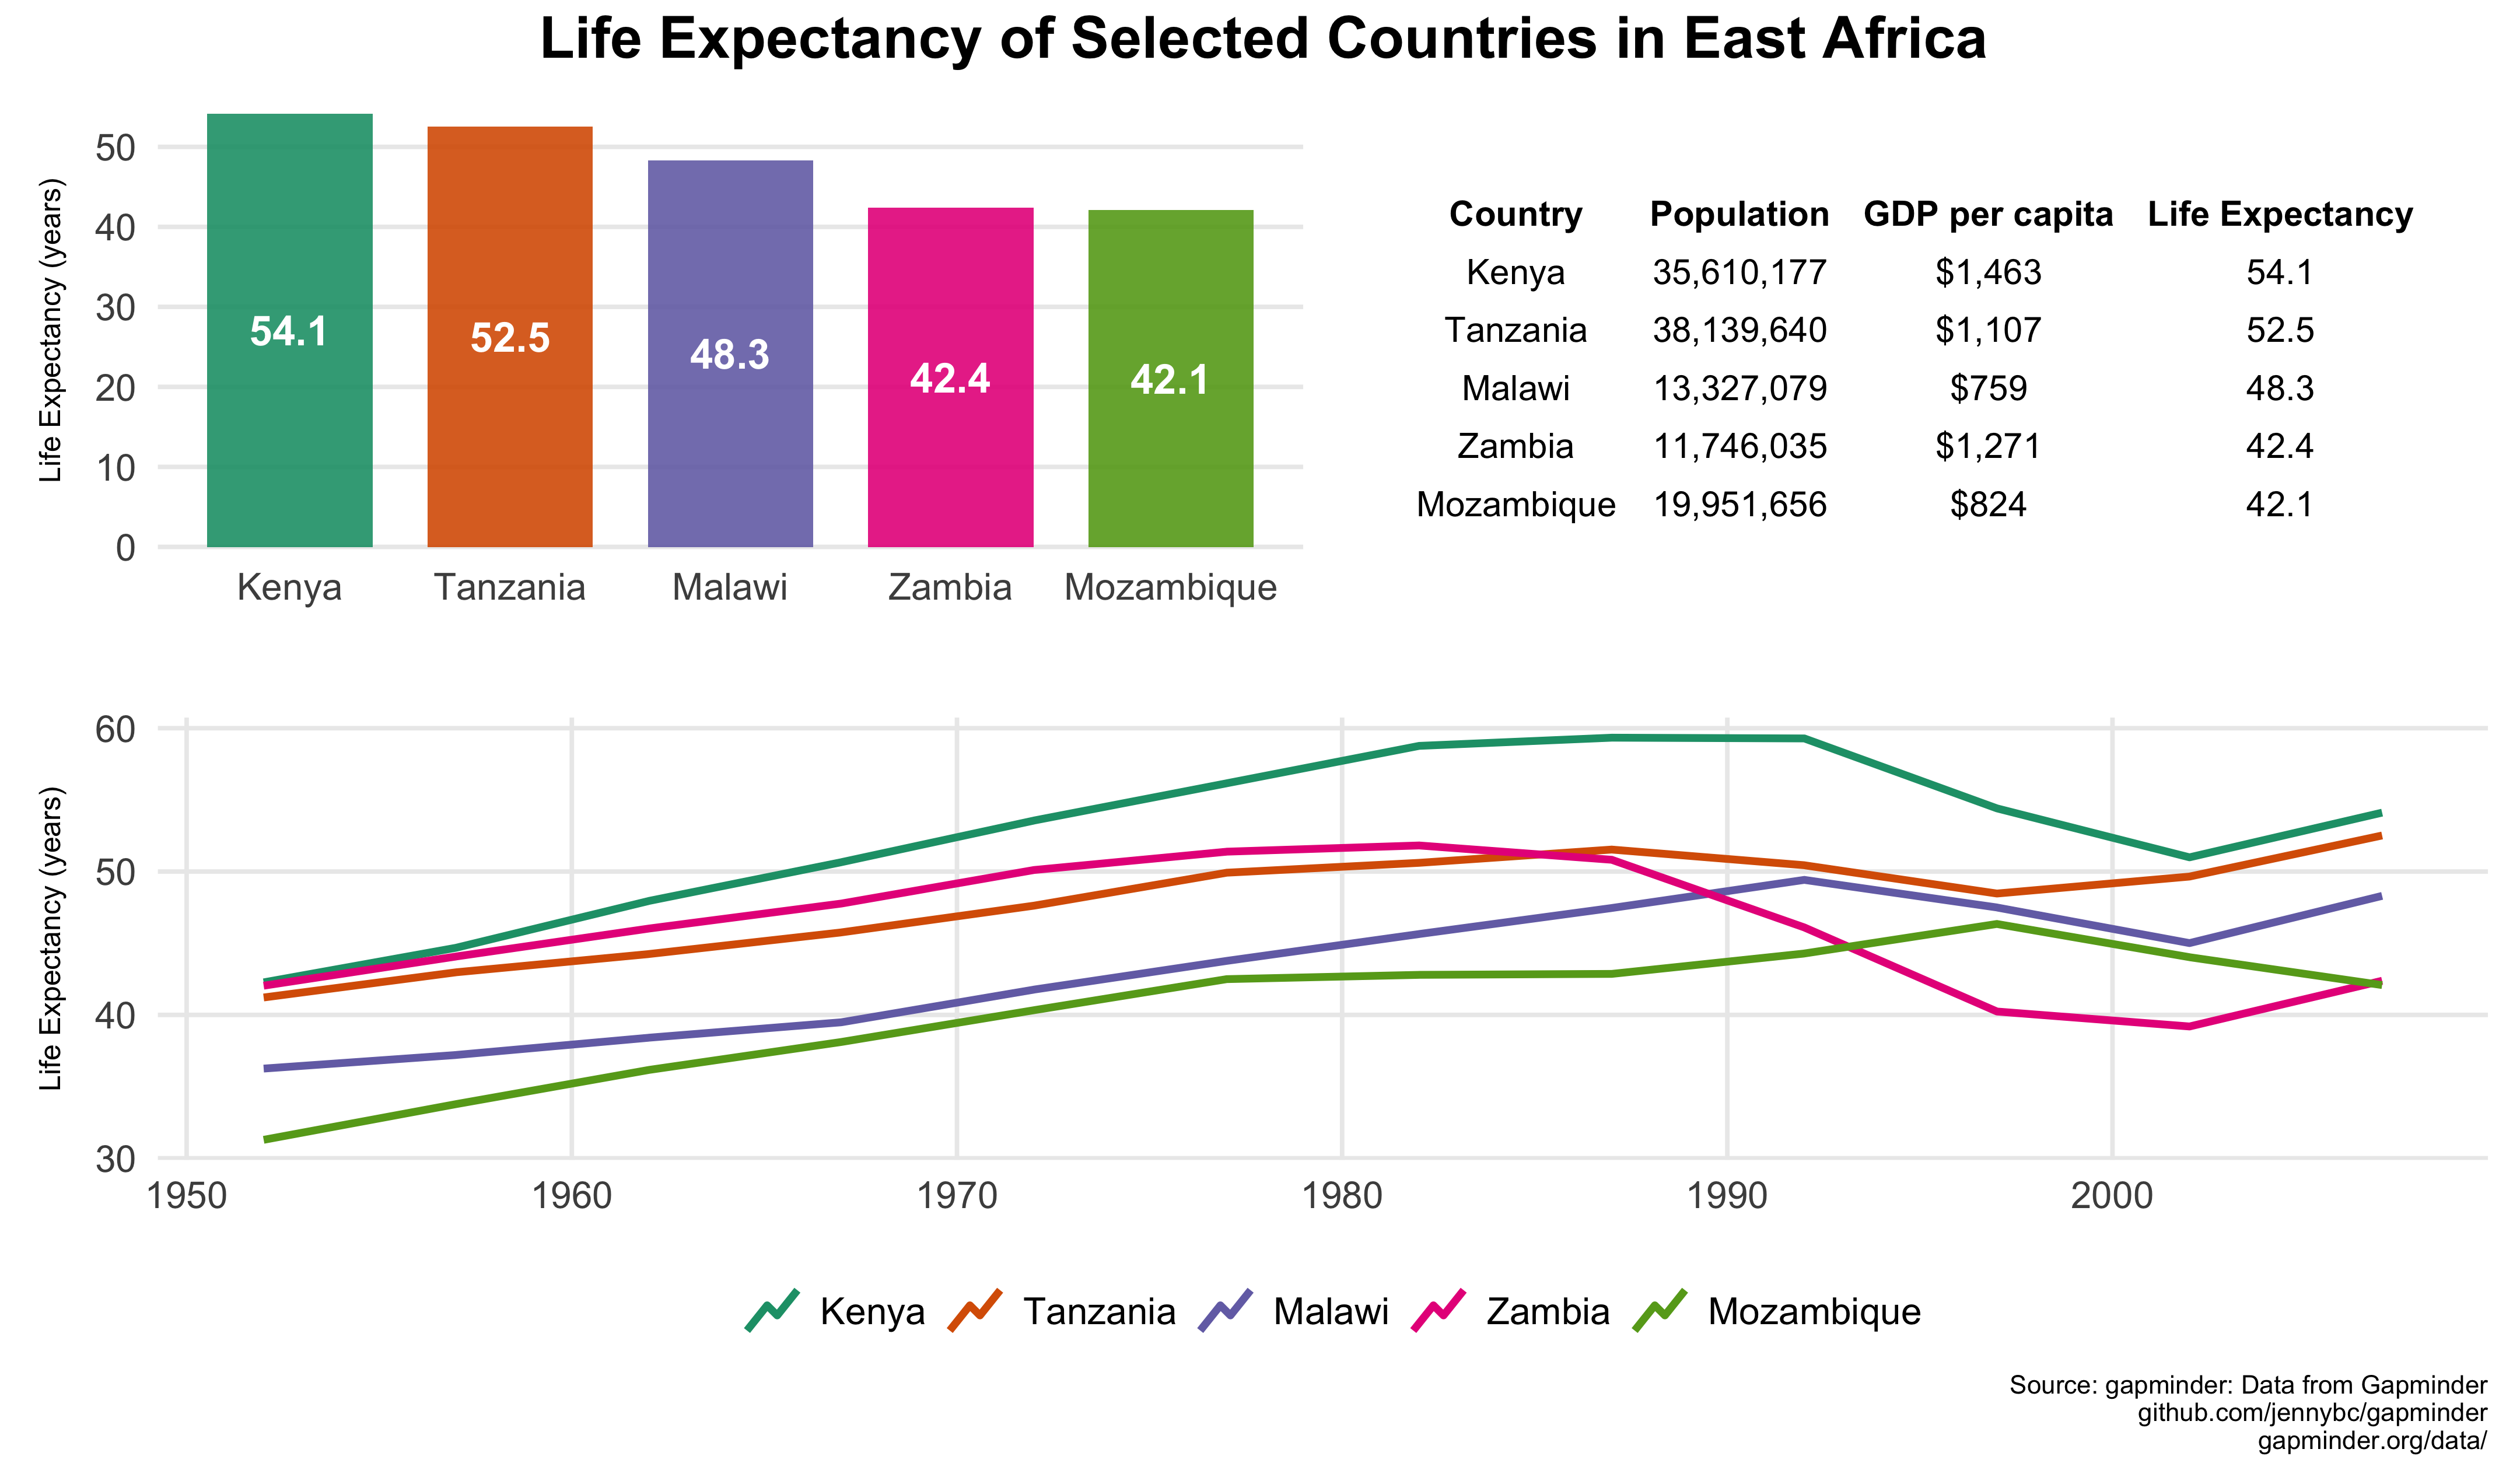
Alright, I’ve got the three graphical elements I want to combine into one layout on a single slide. Now comes the magical patchwork package to assemble these elements into one graphic.
I’m thinking this will look best with the bar chart and table side-by-side on the top half of the slide and the line chart below them. To do this, I take the elements created above and describe their arrangement using the fun patchwork syntax. Then, I’ll add a title and caption to finish off the layout.
layout <- (bar + tab) / line

layout +
  plot_annotation(
  title = "Life Expectancy of Selected Countries in East Africa",
  caption = "Source: gapminder: Data from Gapminder
             github.com/jennybc/gapminder
             gapminder.org/data/",
  theme = theme(plot.title = element_text(size = 20, hjust = 0.5, face = "bold"))
  )
All that’s left to do is to get this onto a PowerPoint slide!
First, create a new R Markdown document and specify powerpoint_presentation as the output format in the YAML header:
---
title: "Multi-image slide layouts in PowerPoint via R Markdown"
author: "Matt Herman"
output:
  powerpoint_presentation:
    reference_doc: template.pptx
---
If you want to use a PowerPoint template, you can specify a reference document in the header. This can be useful if you need to match a corporate brand or theme.
Then, in the body of the R Markdown file, create a code chunk with all the above code to create the plots and layouts. Finally, click the Knit button from RStudio or run rmarkdown::render() to generate the PowerPoint presentation. And here is a screenshot of resulting presentation:
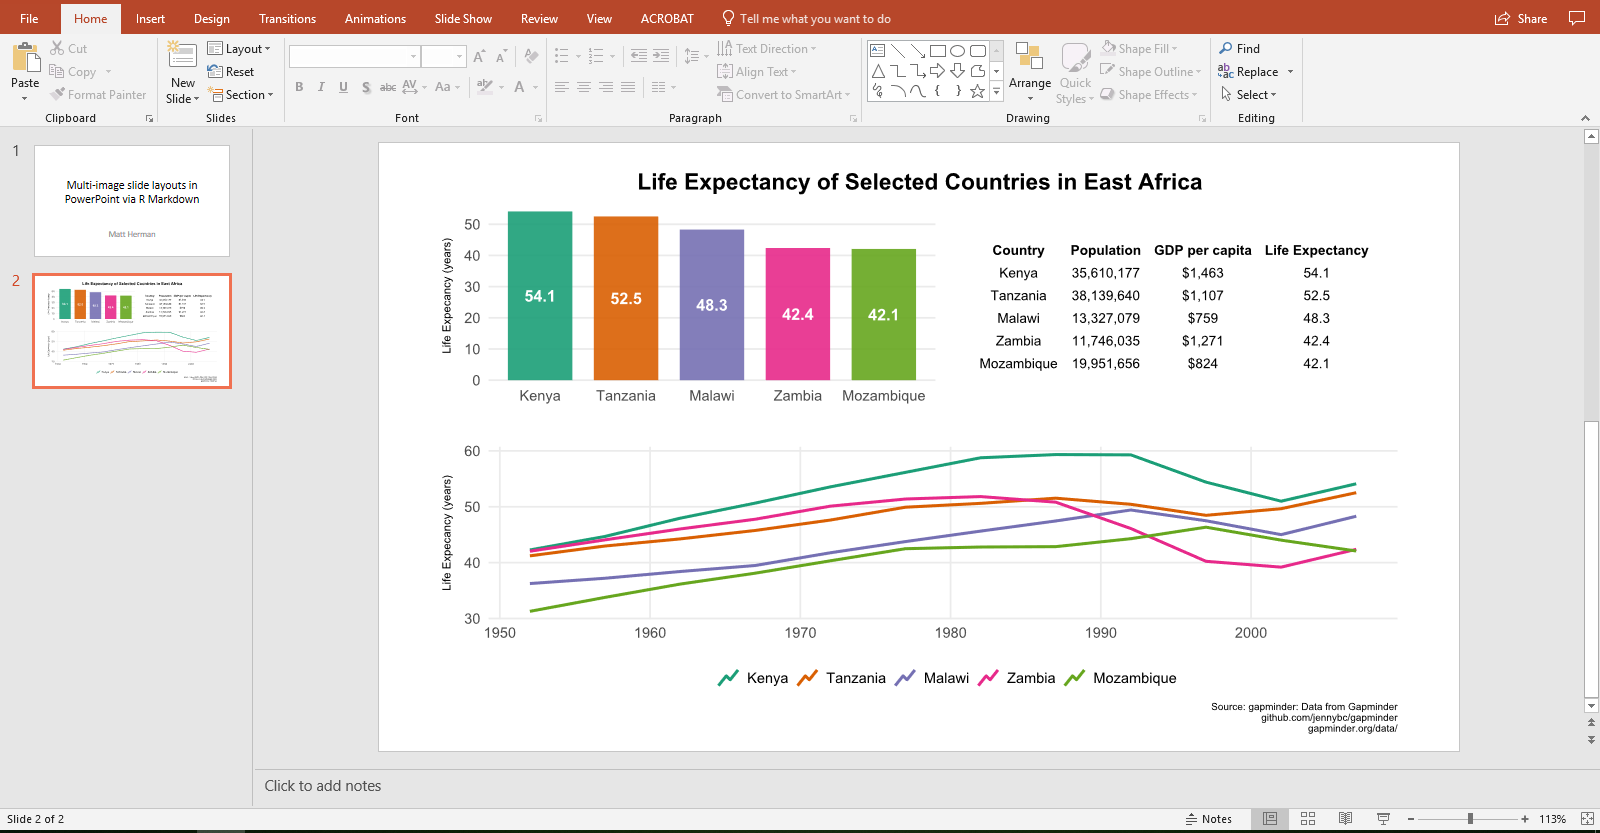
One thing that took a little trial and error was setting the fig.width and fig.height options of the knitr chunk as well as the dimensions of the content area in the PowerPoint template so that the patchwork layout fills the slides appropriately.
This example demonstrated how to make a singe PowerPoint slide with multiple images using patchwork. But of course, one of the super powers of programmatically creating slides is that you can very easily create a second or third or fourth slide with other countries specified. One nice way to implement this would be to use a parameterized child document and iterate through different sets of countries. (Next blog post, perhaps?)
You can find the complete R Markdown file, the PowerPoint template I used, and the rendered PowerPoint on GitHub.


